What’s happening in the Brooklyn and Manhattan housing markets right now?
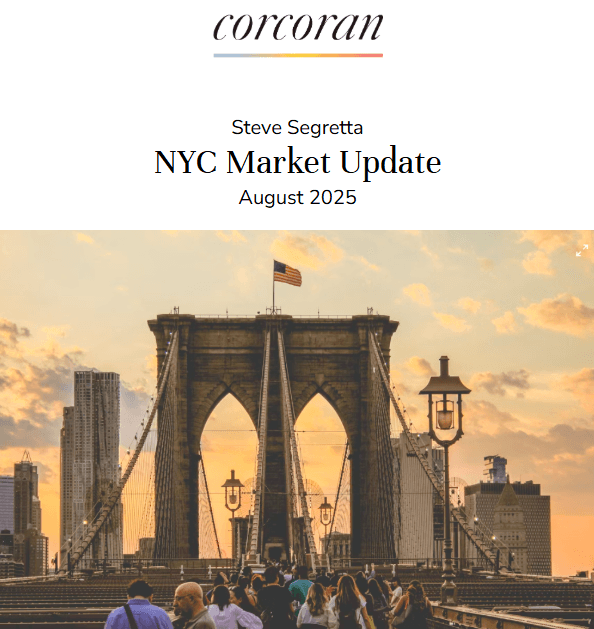
Please click the image for the full newsletter, including research, news, events and more!
Welcome to August!
As we work our way through the summer, the market has slowed quite a bit with less new inventory, reduced buyer traffic and summer vacations in full swing. In addition to the typical summer slowdown, politics and rates have contributed to the weight on the market. Our second quarter-end market reports for Manhattan and Brooklyn highlight general price sensitivity, neighborhood variation, and a clear distinction between what’s selling—and what’s sitting.
Manhattan: Steady Demand and Firm Pricing
For the second consecutive quarter, demand improved across the board in Manhattan. Closings rose 5% year-over-year to nearly 3,260 sales, making this the best second quarter since 2022. With prices also rising, sales volume surged 12% annually to $7.09 billion.
Signed contracts increased for the fifth consecutive quarter, climbing 3% to nearly 3,300 deals, marking the second-longest streak of annual gains since 2009. Active listings declined 2% year-over-year to 7,362, marking a full year of shrinking supply. Fewer new developments launched, and more listings were pulled from the market, reducing inventory.
Stronger sales combined with lower inventory drove marketing times down by more than a week versus 2024, reaching a three‑year low of 120 days.
For buyers, lower days on market mean that well‑priced homes move quickly, so pre‑approval and decisiveness are key. For sellers, the market is rewarding realistic pricing and quality presentation. Homes positioned well are selling faster than last year.
Brooklyn: Cooling Volume, Targeted Competition
Brooklyn’s market began the quarter with momentum but finished below early expectations as economic and political headwinds affected buyer confidence. Closings fell 17% year-over-year to 1,169 sales, the second‑lowest Q2 in 12 years. Signed contracts declined 5% to 1,048, ending a three‑quarter streak of annual gains.
Median price fell 3% to $810,000, though the decline was versus a three-year high reached last year. Additionally, fewer new development closings affected average prices, as new development tends to be more highly priced. Inventory tightened 1% year-over-year to 1,862 listings, with homes under $1M—over 60% of the market—down 7%. This reduction made it more difficult for price-sensitive buyers to find suitable options, intensifying competition in an already tight market.
Marketing time fell 13% to 85 days, showing that well‑priced listings continued to attract buyers quickly despite softer volume.
For buyers, Brooklyn continues to present opportunities, but those targeting high demand listings should still be prepared for less available options and multiple-offer situations. For sellers, select resale properties attract demand, while new development and higher‑end listings require patience and more strategic marketing.
Final Thoughts
Q2 2025 highlighted market selectivity and speed. Manhattan showed measured strength, with more sales and faster absorption. Brooklyn was skewed more towards price‑sensitive demand with active, but selective buyers. Well‑priced, well‑prepared listings are moving, while over‑optimistic sellers risk extended marketing times.
I expect the market to perk up again in September as is typically the case. Given our current tracking of seasonal trends in both Manhattan and Brooklyn, we should start to see renewed listing activity and normalized demand when everyone returns from their summer holidays.
Enjoy this month’s newsletter, including curated articles, market insights, and upcoming local events below. Have a great August and see you in September!
Also, if you’re thinking about a move or simply curious about your options, I’d be happy to connect for a no-pressure conversation tailored to your goals.
Wishing you a great summer, and as always, don’t hesitate to reach out!
All the Best,
Steve

